Google Career - Data Analysis Capstone 1

Summary: Data analysis capstone project analyzing a bicycle rental company
Date: 2022-07-18
Client: Self
Tech Stack: R, Google Suite, Markdown
Return Home
🔗 Project documentation (on Github)
🔗 Project report (on Google Docs)
🔗 Project presentation (on Google Slides)
About Google Career Certificate - Data Analysis
I recently decided to give the Google Career Course Certificate program a whirl, and the first one that I did was the course on data analysis.
The course is split into eight sections targeting different aspects of data analysis. It is all online using on-demand videos and readings through Coursera. The cost of the course is $39 per month (Coursera fee). It is described as being a course that is completed in 4-6 months depending on how much you do, however (while not currently finished) think I will complete it in about one month total. I should note that I can spend a good chunk of a full day dedicated to it and having some background in using spreadsheets, databases, and programming languages some of the concepts were probably a bit easier for me than to someone who may take the course with little to no background in these areas.
The courses cover the basic steps and terms commonly used in data analysis projects, spreadsheet basics, database (SQL) basics, visualization basics (Tableau), and the basics of R and R Studio. Finally, it wraps up with either two pre-made capstone projects (this article covers the first capstone project) or one project of your choice (you can of course choose to do all three projects if you want).
This article will focus more on the first capstone project, but I will write up another article later that reflects and reviews the full course for those interested.
Capstone Project #1
Project Background
The first capstone project is for a made up bicycle sharing company called Cyclistic. They have two types of members - annual members who pay on a monthly basis for unlimited usage and casual members who pay per trip or per day. The company wants to convert casual members into annual members. Your task is to analyze the past 12 months worth of data to determine how annual and casual members differ in their usage of Cyclistic bicycles.
Accessing Data
The project gives you access to data to use for this project. In total there were 12 individual CSV files to download (one for each month).
Data Cleaning
Data cleaning was relatively straightforward as each month was already formatted correctly and didn't contain errors. The only major issue was that some of the rides ended before they began, so those rows had to be removed.
Data Analysis
You are given the choice of using a spreadsheet, database, or R for completing this project. Having worked with programming languages, for me it was the most comfortable choice. There is quite a lot of data, so I wouldn't recommend completely this project with a spreadsheet as it will likely take either Excel or Google Sheets quite a while to run each task. Using a database (like BigQuery) would also work quite well, and for an entry level analyst position getting more familiar with SQL would probably be recommended, but like I said I opted for R and R Studio.
To complete the actual tasks outlined in the project guidelines was pretty simple. The bigger challenge for me was A) learning the different functions available in R and B) getting used to the syntax for using the functions in R. The first challenge was the issue of DRY (Don't Repeat Yourself) code. It would be quite simple to just run a couple of basic functions over each dataset to clean it, create the necessary calculations, and so on. But you would have to run each function 12 times (once for each month). So, it didn't seem like a good idea to do it that way.
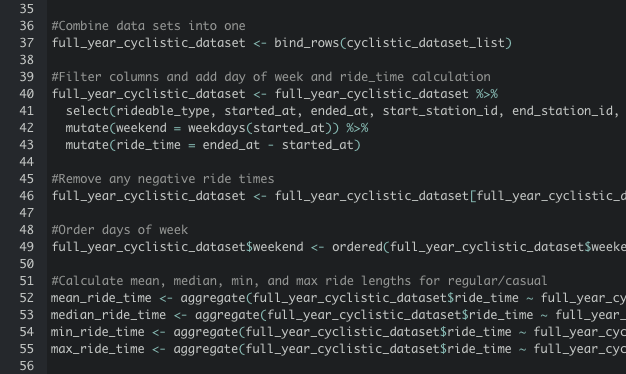
The two functions I found were to A) use a for loop or B) use the lapply function. While I'm still not 100% on the lapply function, it didn't seem quite like the tool I needed. So, I tried to use a for loop. What I wanted to do was basically write out a function that would run the same 'cleaning' checks and functions on each data set, and then save that new data set into a new dynamically named data frame. And it almost worked. However, creating a custom data frame and then saving into that data frame proved to be tricky (and I'm still not entirely sure what's the best way to do that). In the end, I ended up just doing what the guidelines recommended which was to just combine all the data sets into one massive data set and then just work on that one.
After that it was pretty straightforward in removing unneeded columns and adding a couple new columns for new data (the total time of each ride and the day of the week of the ride). Fortunately, R has some very nice functions for easily calculating those two things in just one line of code. The final step was to calculate the average (mean), median, minimum, and maximum times for rides for both Casual and Annual members. Again, R very conveniently has ways to calculate these things with minimal work.
After running all those calculations I decided that, with the much smaller data set, it would be easy and simpler to do the visualizations in a spreadsheet. So, I exported the new data sets as CSV files and uploaded them into Google Sheets.
Creating Visualizations
The visualizations were quite easy to create in Google Sheets. In total I created six visualizations from the final data set (all of them can be seen in the linked documentation, report, and presentation at the top).
A bar chart comparing the average and median ride times for Casual vs Annual members.
Line graphs comparing the average and median ride times for Casual and Annual members for each day of the week.
A bar chart comparing the total rides taken by Casual vs Annual members for each day of the week.
Pie charts comparing the percentage of Casual vs Annual members for total usage in hours and total rides taken.
Final Analysis and Recommendations
The final analysis was pretty straightforward as the data revealed some very clear trends in differences between Casual and Annual members. The slightly harder part was the recommendations. I found this part a little difficult because the project prompt and background does not give you a whole lot of information outside of the general ideas. So, I felt like my recommendations were more on the general side of things which felt a little off (maybe in the real world this is normal?). I also felt like the recommendations would target more of the overall end goal of the project, but given the analysis only covers the first step of the full project it was not possible to do that. So, again it felt a little off to me. Like I couldn't really make any recommendations to the project's overall goals except to say that "yes, there is a difference in how members use the bicycles". Since the data does come from real people in the real world a lot was not available. But anyway 🤷🏻♂️
Reflections
Overall, I found this project to be useful as a capstone. Initially working with R and R Studio was a little aggravating. While I thought the course did a decent job of covering the basics, as always, once you're in the 'real world' of things nothing seems as simple and as easy as it did in tutorial world. But of course it was good practice to have to dive back into searching and using Stack Overflow to find how to write the different functions and figuring out what was recommended to complete the tasks I needed to do. After a day or two of just searching and playing around with R's syntax things started to click again and go more smoothly.
We'll see what happens in the second capstone project, but I think it would be nice if there was a little more 'conclusion' to the project. Although I'll again admit that maybe this is what it actually feels like and works like in real life. But it'd be nice to have the project you do go to the actual end with recommendations from the data rather than just take you to the end of step 1.
While I'd still like to continue to improve my proficiency in R and using R Studio, I think I'll probably try to use BigQuery and SQL for the second capstone just to get a start and better grasp on that.
Questions
Like I said at the beginning, I'll write a separate post for the second capstone project as well as for an overall review on the Google Career Course Certificate - Data Analysis program later. But, if you have any questions about this capstone project or comments on better using R, please do send an email to coffeeaje0113@gmail.com.
Thank you for reading!